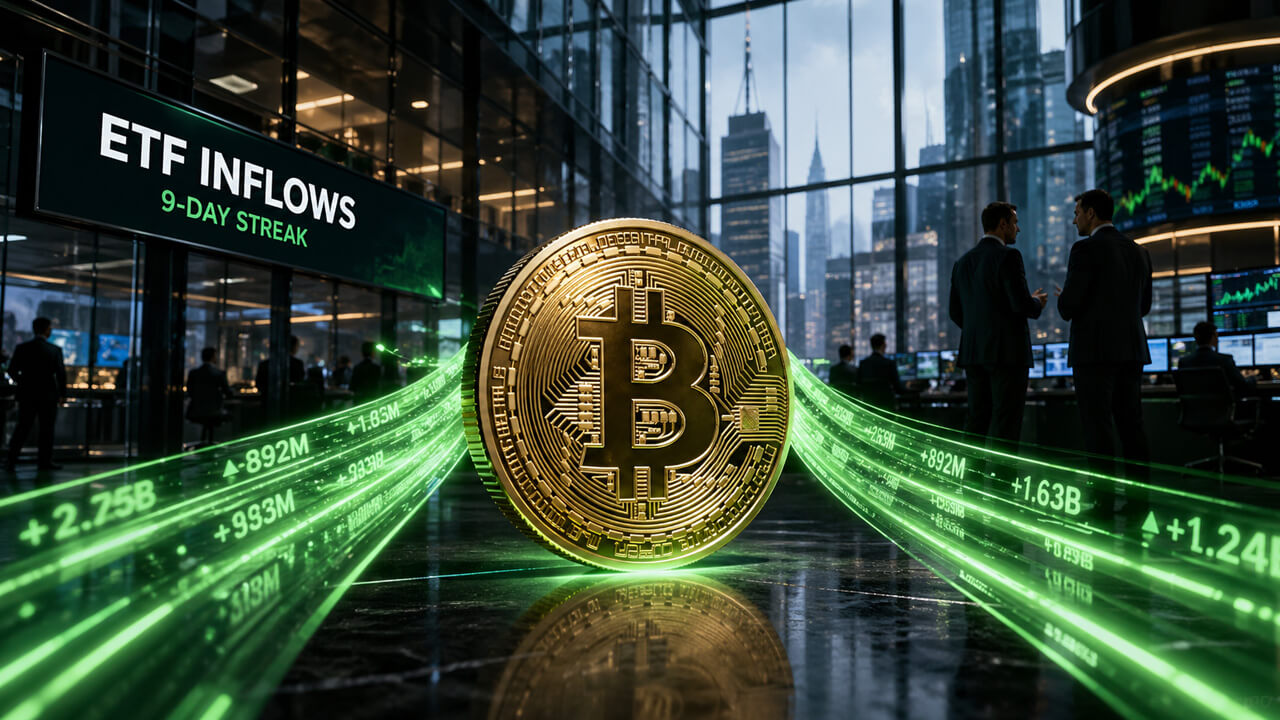
The nine-day inflow streak is the longest of 2026, putting ETFs back at the center of Bitcoin’s test of the $80,000 resistance.
US spot Bitcoin ETFs just logged their longest inflow streak of 2026, with nine consecutive days of net additions through April 24. The surg...
SoSoValue data shows the nine-day inflow run added approximately $2.12 billion since April 14, marking the strongest stretch since last Octo...
US spot Bitcoin ETFs just logged their longest inflow streak of 2026, with nine consecutive days of net additions through April 24. The surge has pushed total fund assets to a record 6.57% of Bitcoin’s circulating supply, reigniting the debate over whether institutional demand can finally drive BTC above $80,000.
The Signal
SoSoValue data shows the nine-day inflow run added approximately $2.12 billion since April 14, marking the strongest stretch since last October’s buying frenzy. BlackRock’s iShares Bitcoin Trust led the charge with $1.6 billion, followed by Morgan Stanley’s Bitcoin Trust ($115 million) and Grayscale’s product ($73 million). Total net assets across US spot Bitcoin ETFs now sit at roughly $101 billion, representing 6.57% of Bitcoin’s market cap.
bitcoin trading floor
Bitcoin has rallied about 11% over the past month, currently trading near $78,000. The inflow streak gives the market a clearer support base than during the prior correction, but the scale of demand remains below the level typically associated with a durable breakout. Bloomberg ETF analyst Eric Balchunas noted that rolling flow periods for Bitcoin ETFs have turned positive again after months of weakness, with IBIT’s recent intake ranking among the strongest across the broader ETF market.
“The nine-day inflow streak is the longest of 2026, putting ETFs back at the center of Bitcoin’s test of the $80,000 resistance.”
On-Chain Data
On-Chain Data
30-Day Net Inflow Threshold: Macro research firm Ecoinometrics estimates that roughly 50,000 BTC in net inflows over 30 days is needed for odds to shift decisively toward sustained positive returns. Current flows are below that level.
Aggregate Cost Basis: Bitwise data shows the average cost basis for US spot Bitcoin ETF buyers is about $81,000 as of April 24. IBIT’s cost basis is $80,200, while Fidelity’s FBTC and Bitwise’s BITB are lower at $59,300 and $55,400, respectively.
ETF Share of Supply: The ETF complex now holds 6.57% of Bitcoin’s total supply, a record high that reflects growing institutional adoption.
data analytics dashboard
Market Impact
The inflow recovery provides Bitcoin with a stronger support base than during the prior correction, when ETF demand had cooled significantly. However, the current pace of inflows is not yet enough to validate a sustained breakout. Ecoinometrics’ model suggests that while capital is returning, the 30-day net inflow rate must exceed 50,000 BTC to significantly tilt probabilities toward positive returns.
The $80,000 area is critical because the aggregate cost basis for ETF buyers sits at $81,000. Many recent purchasers are near breakeven, meaning a move above $80,000 could reinforce confidence, while a rejection might trigger profit-taking and hedging. Bitwise data highlights that IBIT’s cost basis is just above current prices, making it a key level to watch.
Your Alpha
Your Alpha
1Watch the 50,000 BTC threshold: If ETF inflows maintain their current trajectory and push 30-day net additions above 50,000 BTC, the odds of a bullish breakout increase significantly. Monitor SoSoValue and Ecoinometrics data.
2Focus on the $81,000 cost basis: If Bitcoin breaks above $80,000, selling pressure could emerge near $81,000 as ETF buyers look to exit at breakeven. A clear move above $82,000 would be a strong bullish signal.
3Consider correlated plays: Strength in Bitcoin ETFs could benefit mining stocks like Marathon Digital (MARA) and Riot Platforms (RIOT), as well as DeFi protocols offering synthetic BTC exposure.
crypto trader analyzing charts
Next Catalyst
The next major catalyst is the potential approval of options on spot Bitcoin ETFs by the SEC. Multiple issuers have filed proposals, and a green light could unleash a new wave of institutional demand and volatility. Additionally, the Federal Reserve’s May meeting and April inflation data will shape risk appetite. A stable or dovish rate environment could further boost ETF inflows.
The Bottom Line
The Bottom Line
US spot Bitcoin ETFs are on their longest inflow streak of 2026, with $2.12 billion added and a record 6.57% of BTC supply now held in these funds. This strengthens Bitcoin’s support near $78,000, but the $80,000 resistance remains a formidable wall. The key levels to watch are the 50,000 BTC 30-day inflow threshold and the $81,000 aggregate cost basis. If both are breached, Bitcoin could be poised for a sustained rally.
Additional Analysis: Market Implications
The ETF surge is not just a sign of institutional confidence; it is also altering Bitcoin’s supply-demand dynamics. With 6.57% of total supply held in these funds, available liquidity in the market is reduced, which could amplify price movements both up and down. Moreover, the concentration of holdings in large players like BlackRock introduces a new systemic risk: if these funds face massive redemptions, the impact on price could be severe.
On the other hand, institutional capital flowing through ETFs is legitimizing Bitcoin as a traditional investment asset, potentially attracting more pension funds and insurers. However, it also raises concerns about decentralization, as a growing portion of supply is controlled by a few entities.
Historical Context
Historical Context
The current inflow streak is the longest since October 2025, when ETFs logged 12 consecutive positive flow days. At that time, Bitcoin reached a local high of $76,000 before correcting. The difference now is that the cost basis of ETF holders is higher, suggesting that support could be more solid. However, the 50,000 BTC 30-day threshold remains a key barrier not surpassed since November 2025.
Trading Strategies
For traders, the $80,000 level is a tipping point. A convincing break above $82,000 on volume could trigger a rally toward $90,000. Conversely, if the price fails to clear $80,000 in the coming days, a double top could form, leading to a correction toward $72,000. Options on ETFs, if approved, would add a new layer of complexity and hedging opportunities.
Risks to Consider
Risks to Consider
Despite the optimism, significant risks remain. Persistent inflation could keep the Fed in a restrictive stance, reducing risk appetite. Additionally, crypto regulation remains uncertain, with potential restrictive measures from the SEC or other bodies. Finally, the concentration of holdings in ETFs could exacerbate volatility in the event of forced liquidation events.