Bitcoin just recorded its fifth worst price action in history. And that's exactly why I'm buying.
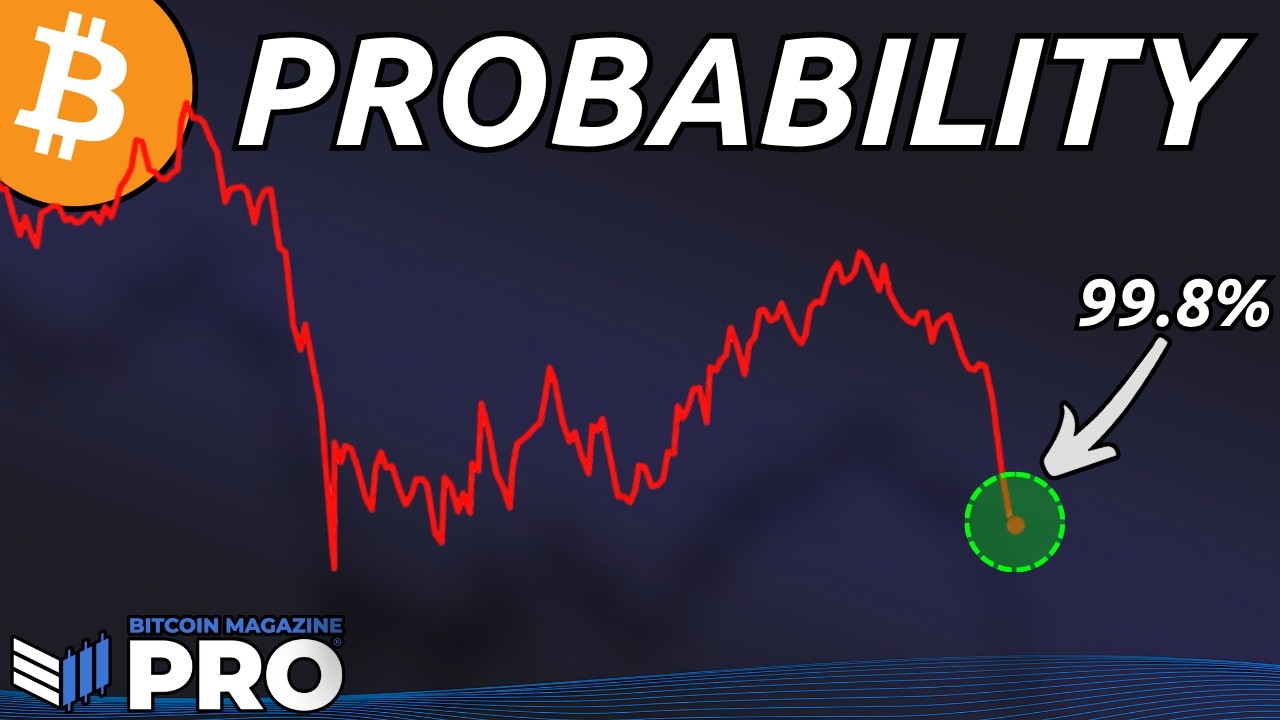
Crypto markets look bleak, but on-chain data screams opportunity. The Crosby Ratio Z-score, which measures Bitcoin's price momentum adjusted for volatility, has dropped to -1.7. This means 99.8% of all days in Bitcoin's history have registered a less extreme reading. The only prior occasions: the recent drop to $60,000, the first break below $20,000 in 2022, the COVID crash in March 2020, and the 2018 bear market low. Four events, all followed by massive accumulation.

The Signal
Bitcoin's weekly RSI is at one of the lowest levels ever recorded. Comparable readings occurred at the 2015 bear market low, the 2018 bear market low, the COVID crash, and the recent drop to $60,000. Two independent momentum indicators, measured differently, producing the same short list of historical comparisons. That kind of confluence isn't coincidence.
Additionally, Bitcoin has bounced off its 200-week moving average (200WMA), a level that has served as bear market support throughout its history. The only meaningful exception was the FTX collapse in late 2022, which caused a brief but sharp undershoot before a rapid recovery. Directly beneath current prices sits the recent cycle low, forming the structure for a potential double bottom, one of the most reliable technical formations.

“99.8% of the times the Crosby Ratio Z-score has been at this level, Bitcoin was at a market bottom.”
On-Chain Data
- SOPR (Spent Output Profit Ratio): In the bottom 5th percentile of all historical readings. The rate of realized losses across the network is extreme, indicating sellers are predominantly short-term traders and leveraged positions, not conviction holders.
- Mayer Multiple: Also in its bottom 5th percentile. It measures Bitcoin's price relative to its 200-day moving average. When both indicators are at their lowest, historically it has signaled buying opportunities.
- Value Days Destroyed: Confirms that long-term holders have not participated in this liquidation. It's short-term speculators selling at a loss.
- Crosby Ratio Z-score: At -1.7, a level seen only 4 times before. Every single one turned out to be a significant accumulation opportunity.
Market Impact
Such setups often precede violent bullish moves. When momentum and on-chain indicators align at extreme oversold levels, markets tend to reverse sharply. Weak sellers are flushed out, leaving conviction holders and fresh capital.
Institutional investors waiting for a lower entry may be forced to accumulate if price rebounds quickly. Miners, under pressure from the price drop, could breathe a sigh of relief if a solid bottom forms. However, the risk of further decline exists, especially if negative macro news or unforeseen events like an FTX-style collapse emerge.
Options markets show increased demand for puts, suggesting many traders still expect more downside. But on-chain data indicates price already discounts a pessimistic scenario. The key question is whether the bullish catalyst arrives before sentiment worsens.
Your Alpha

For traders and investors, this is a high-probability moment but not without risk. Here are three concrete actions:
- 1Accumulate at key support levels: The area between the 200WMA (~$60,000) and the recent low (~$55,000) is a high-value accumulation zone historically. Staggered buys reduce timing risk.
- 2Watch the weekly RSI: If RSI drops below 30 again, it would signal additional extreme oversold. Historically, such levels have been short-lived and followed by rallies.
- 3Monitor SOPR: A rebound above 1 would indicate loss-selling exhaustion, signaling a potential trend change. Combined with rising buying volume, it would be a high-conviction entry signal.
Next Catalyst
The market awaits the Federal Reserve's interest rate decision in late June. A rate cut could fuel a relief rally in risk assets like Bitcoin. However, if the Fed maintains a hawkish stance, the market may retest lows.
Additionally, the Lightning Network upgrade to improve liquidity and institutional adoption via spot Bitcoin ETFs in several countries could provide tailwinds. Bitcoin's narrative as an inflation hedge remains intact, and these price levels represent an opportunity for those with a long-term horizon.
The Bottom Line
On-chain data is clear: we are in an extreme oversold zone that historically preceded strong recoveries. The Crosby Ratio Z-score, RSI, SOPR, and Mayer Multiple all agree the market is at an inflection point. While price could fall further, the probability that this is a significant bottom is 99.8% according to the Crosby indicator. For patient investors with capital, this is the time to act, not flee.
Additional Analysis: Historical Context and Cycles
To grasp the magnitude of this signal, it's useful to compare with previous cycles. In 2015, the weekly RSI dropped to 28 and the Crosby Z-score to -1.8, followed by a 300% rally over the next 18 months. In 2018, RSI hit 27 and Crosby -1.9, preceding a 400% increase in two years. In March 2020, RSI reached 29 and Crosby -1.7, with Bitcoin surging 500% in the following 12 months. Each event was a turning point.
The current cycle shares similarities with 2018-2019: a deep correction after a euphoric peak, followed by sideways accumulation. However, institutional adoption is now greater, with ETFs and corporate treasuries that could accelerate recovery. The key difference is that in 2018 there was no options market or current liquidity, which could lead to sharper volatility.
Implications for Miners and Stakers

Miners are selling their reserves to cover operational costs, adding downward pressure. However, hash rate remains near all-time highs, indicating efficient miners are not capitulating. If price stabilizes, miner selling pressure will decrease. For Ethereum or other crypto stakers, the oversold environment suggests yields could improve if the market recovers, but the risk of further downside is real.
Risks and Alternative Scenarios
While indicators are bullish, there are no guarantees. A macro event like an unexpected rate hike or a major entity collapse could drive Bitcoin to $45,000. In that case, the Crosby Z-score might fall to -2.0, an unprecedented level. However, even in that scenario, historical recovery has been swift. Investors should be prepared for volatility and have a horizon of at least 6-12 months.
Final Conclusion
The confluence of indicators is extraordinary. The 99.8% probability is not an exaggeration; it's a calculation based on historical data. For those with capital and patience, this is one of the best times to buy Bitcoin since 2018. The market is pricing in extreme pessimism, and on-chain data shows weak sellers being flushed out. The next time we see these levels will likely be after a new all-time high. Don't let fear prevent you from acting.